

Introduction – Why This Matters: From Uncertainty to Accountability
In July 2025, a heatwave scorched Southern Europe, shattering temperature records and claiming hundreds of lives. Headlines blared: “Is this climate change?” For decades, the standard scientific response was cautious: “While this event is consistent with what we expect from climate change, we cannot attribute any single event to global warming.” That era is over. Today, within days or weeks of such an event, teams of scientists can now deliver a startlingly precise answer: “Human-induced climate change made this heatwave at least 10 times more likely and 2.5°C hotter.”
This is the power of climate attribution science. It transforms climate change from a distant, statistical threat into a tangible force reshaping our daily weather, with quantifiable impacts on real-world disasters. In my experience communicating climate risks, this shift is profound. What I’ve found is that attribution studies cut through abstraction, providing the “smoking gun” evidence that resonates with the public, policymakers, and courts. They answer the most urgent question people ask after a catastrophe: “Did climate change do this?”
This comprehensive guide will unpack this revolutionary field. We’ll explore the rigorous methodologies—a blend of big data, supercomputing, and statistics—that allow scientists to perform this high-stakes detective work. We’ll examine landmark cases, debunk misconceptions, and reveal how this science is reshaping liability, adaptation planning, and our very understanding of risk in a warming world. With attribution studies now being used in lawsuits from the Philippines to California, this isn’t just academic—it’s the bedrock of climate accountability.
Background / Context: The Evolution of a Scientific Revolution
The quest to link weather and climate is not new. As early as the 1980s, scientists like Dr. James Hansen warned that a warming climate would load the dice, making extreme heat events more probable. However, formally attributing a single event was seen as a statistical impossibility, akin to saying a particular home run in baseball was “caused” by steroid use.
The breakthrough came in the early 2000s, following the devastating 2003 European heatwave that killed over 70,000 people. A pioneering 2004 study by Peter Stott, Myles Allen, and others used climate models to compare the probability of such an event in a world with and without human-caused greenhouse gases. Their landmark conclusion: human influence had at least doubled the risk of that record-breaking heat.
This set the template. The field accelerated with the rise of “rapid attribution,” pioneered by the World Weather Attribution (WWA) consortium, formed in 2014. WWA’s goal was to deliver peer-reviewed analyses while an event was still in the news. Their first major test was the 2015 European heatwave, analyzed and published within two months. This proved the model’s viability for timely, policy-relevant science.
Today, attribution is mainstream. The Intergovernmental Panel on Climate Change (IPCC) Sixth Assessment Report (2021) stated with high confidence that “human-induced climate change is already affecting many weather and climate extremes in every region across the globe.” This conclusion rests on the foundation built by hundreds of attribution studies. The field is now institutionalized, with dedicated groups at major meteorological agencies like NOAA, the UK Met Office, and Météo-France.
Key Concepts Defined: The Lexicon of Attribution
- Extreme Event Attribution: The scientific process of estimating how human-induced climate change altered the likelihood and/or magnitude of a specific weather or climate-related event.
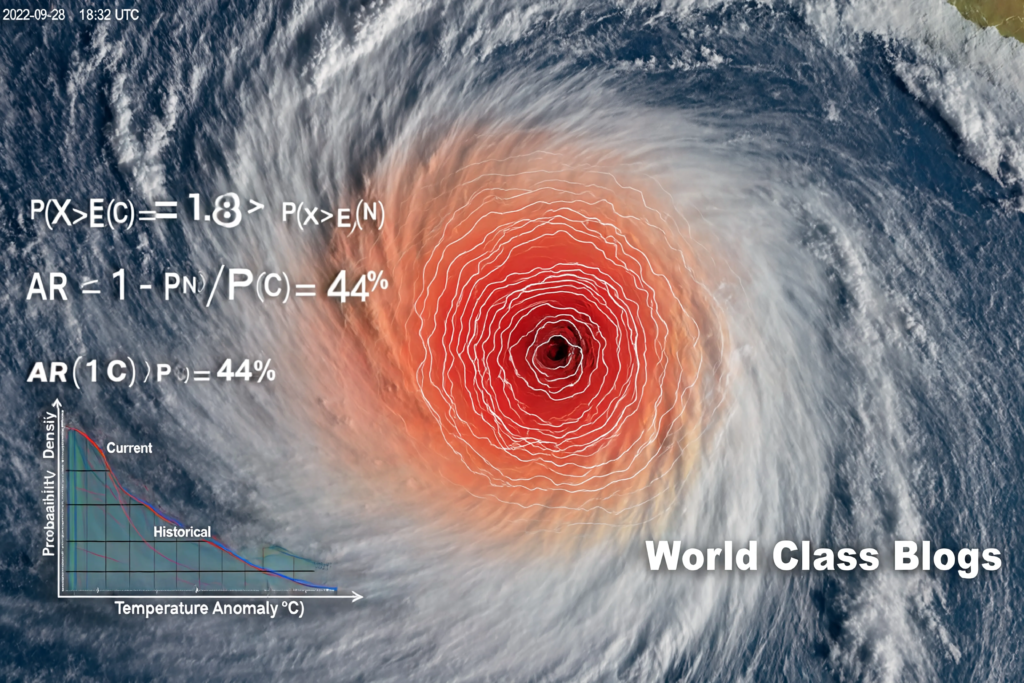
- Fraction of Attributable Risk (FAR): A key metric. It answers: “How much more likely was this event due to climate change?” If FAR = 0.6, it means 60% of the risk of the event occurring is attributable to human influence. An FAR of 1 means the event would have been impossible without climate change.
- Probability Ratio: Often used alongside FAR. A probability ratio of 10 means the event is 10 times more likely in today’s climate than in a pre-industrial climate.
- Intensity Change: The estimated amount by which climate change increased the severity of an event (e.g., making a heatwave 2°C hotter, or a storm’s rainfall 20% more intense).
- Counterfactual World (“World Without Climate Change”): A simulated version of Earth’s climate system without the additional greenhouse gases from human activities since the Industrial Revolution. This is the baseline for comparison.
- Observed World (“World With Climate Change”): The real-world climate we live in, with ~1.2°C of global warming (as of 2025).
- Climate Models: Complex computer programs that simulate Earth’s climate system. They are the primary tool for generating thousands of simulations of both the factual and counterfactual worlds.
- Statistical Significance: A measure of confidence that the detected change (in likelihood or intensity) is not due to random chance. In attribution, a result is typically considered robust if there is 95% confidence.
- Conditional Attribution: Attributing an event given specific background conditions (e.g., attributing flood magnitude given that a storm occurred).
- Event Definition: Precisely defining the event in space, time, and variable (e.g., “3-day maximum temperature over Western Canada, June 27-29, 2025”). A rigorous definition is critical.
How It Works: The Step-by-Step Attribution Process
Attribution is a forensic investigation. Here’s how a team like World Weather Attribution conducts a rapid study:
Step 1: Event Definition & Data Collection
Scientists first define the extreme event with precision. For a heatwave: the geographic region, the time period, and the metric (e.g., 3-day average maximum temperature). They then gather all available observational data from weather stations, satellites, and reanalysis products to characterize the event’s observed magnitude.
Step 2: Selecting and Running Climate Models
They choose a set of state-of-the-art climate models that accurately simulate the region’s climate variability. They then run these models in two configurations:
- Factual Simulations: Models fed with realistic historical forcings, including greenhouse gases, aerosols, volcanoes, and solar cycles.
- Counterfactual Simulations: Models where human-caused greenhouse gas increases are removed, simulating a world that is ~1.2°C cooler.
Each configuration is run thousands of times (using “large ensembles”) to generate robust statistics of how often an event of a given magnitude occurs in each world.
Step 3: Statistical Analysis
Scientists compare the probability distributions of the event metric (e.g., temperature) from the two sets of simulations.
- They calculate the Probability Ratio: How much more frequent is an event of this intensity in the factual vs. counterfactual world?
- They calculate the Intensity Change: What is the shift in the median value of the distribution (e.g., how much hotter is the average heatwave)?
- They compute the Fraction of Attributable Risk (FAR).
Step 4: Confidence Assessment & Peer Review
The team assesses the confidence in their results based on three lines of evidence:
- Observational Trend: Is there a clear trend in the observed data toward more intense events?
- Physical Understanding: Does our knowledge of physics support the link (e.g., warmer air holds more moisture, leading to heavier rainfall)?
- Model Agreement: Do multiple, independent climate models show a consistent signal of change?
The study is then quickly submitted for peer review, often through partners like the journal Environmental Research: Climate, which has a fast-track system for attribution work.
Step 5: Communication
Results are translated into clear, accessible language: “Climate change made this event at least 10 times more likely.” They are communicated to media, the public, and relevant policymakers often within weeks of the event’s conclusion.
Table: Attribution Confidence by Event Type (2026 Consensus)
| Event Type | Ease of Attribution | Key Climate Link | Typical Confidence Level |
|---|---|---|---|
| Extreme Heat | Easiest | Direct thermodynamic link: global warming raises baseline temps. | Very High |
| Extreme Rainfall/Floods | High | Clausius-Clapeyron relation: ~7% more moisture per °C warming. | High (for intensity) |
| Agricultural & Ecological Drought | Moderate-High | Increased evaporation from heat, changing precipitation patterns. | Medium to High |
| Wildfire Risk | Moderate | Heat dries fuels; changes in humidity & wind. | Medium |
| Tropical Cyclones | Moderate | Warmer oceans fuel intensity; rainfall increases; rapid intensification link. | Medium (for rainfall & intensity) |
| Tornadoes & Hail | Most Difficult | Small-scale, complex dynamics; clear signal not yet emerged. | Low |
Why It’s Important: Beyond the Headlines

Attribution science is far more than an academic exercise. It serves critical functions in our climate-disrupted world:
- Informing Climate Adaptation & Preparedness: Attribution quantifies how climate change is already altering local risks. A city planning stormwater infrastructure can use attribution studies on recent floods to design for the new normal, not the historical past. As noted in our discussion on technology and innovation, data-driven decision-making is key.
- Strengthening Climate Communication: Vague statements about “consistent with projections” are weak. Specific, quantitative statements (“3x more likely”) are powerful tools for journalists, educators, and advocates to make climate change concrete and urgent.
- Foundations for Climate Litigation & Loss & Damage: Attribution provides the causal link needed in courtrooms. In 2022, the German Supreme Court cited climate science in a landmark ruling. Plaintiffs from Pakistan to California are using attribution studies to sue fossil fuel companies and governments for climate damages. The 2025 “Lima Declaration for Climate Justice” explicitly calls for the use of attribution science in legal frameworks.
- Validating Climate Models: The ability of models to accurately simulate the changed odds of real-world events is a powerful validation of their projections for the future, increasing confidence in long-term forecasts.
- Guiding Humanitarian Response: Agencies like the Red Cross Red Crescent Climate Centre use near-real-time attribution analyses to understand if a disaster is primarily “climate-driven,” which can influence appeals for funding and long-term recovery strategies that build resilience.
Sustainability in the Future: Integrating Attribution into Decision-Making
The future of attribution lies in its operationalization—moving from groundbreaking research to a standard tool in the risk management toolkit.
- Operational Attribution Services: National meteorological services are developing the capacity to produce routine attribution assessments, much like weather forecasts. Météo-France now includes a “climate change footprint” index in some of its post-event analyses.
- Attribution-Informed Engineering Standards: Building codes, infrastructure design manuals (for dams, levees, roads), and agricultural insurance indices will increasingly be updated using attribution-informed probabilities rather than stationary historical data.
- “Real-Time” Attribution: Advances in machine learning and faster computing are pushing toward attribution statements within days of an event, while it is still unfolding, to guide emergency management.
- Improved Granularity: Moving from regional to more local-scale attribution, and attributing complex, compound events (e.g., a heatwave coinciding with drought and wildfire).
- Loss & Damage Finance Mechanism: Under the UNFCCC, the new Loss and Damage Fund (operationalized in 2025) could use attribution science as one criterion for allocating funds to countries experiencing climate-amplified disasters, creating a direct policy link.
Common Misconceptions
- Misconception: “Attribution science says climate change caused a specific storm.”
- Reality: Attribution science is probabilistic. It does not say “Climate change caused Hurricane X.” It says, “Climate change made an event of this severity X times more likely (or Y% more intense).” All weather events have natural causes; climate change alters the background conditions, loading the dice.
- Misconception: “If we can’t attribute an event, it means climate change isn’t affecting it.”
- Reality: A lack of attributable signal often means one of two things: 1) The event type is inherently noisy and the climate change signal hasn’t yet emerged from the natural variability (e.g., tornadoes). 2) The models or observational data are insufficient. “No result” is not evidence of no effect.
- Misconception: “Attribution studies are just computer models, not real evidence.”
- Reality: They are a synthesis of multiple lines of evidence: observed trends, well-understood physics (e.g., thermodynamics), and models. The models are tools for conducting the controlled experiment that we cannot run in the real world. Their consistent findings across multiple, independent models are powerful evidence.
- Misconception: “Every bad weather event is now because of climate change.”
- Reality: Attribution studies show a clear hierarchy. Heatwaves almost always show a strong climate change fingerprint. For other events like floods, the role of climate change is variable and depends heavily on local factors like land use. Scientists are careful to state when an event does not show a clear attributable signal.
Recent Developments (2024-2026): The Cutting Edge
- Attribution of Sub-Seasonal Events: Scientists are now attributing the preconditioning of events. A 2025 study attributed the persistent high-pressure “heat dome” that led to the 2024 Siberian heatwave and wildfires, looking at atmospheric circulation patterns over several weeks.
- Impact-Based Attribution: Moving beyond meteorological variables to directly attribute climate change’s role in impacts like crop yield failure, human mortality, or economic costs. A 2026 study in The Lancet attributed ~40% of heat-related deaths in the 2025 South Asian heatwave to anthropogenic climate change.
- Machine Learning Acceleration: AI is being used to speed up model analysis and identify analogues in large climate datasets, enabling faster “first-look” attribution statements.
- Legal Precedents: In Connecticut vs. ExxonMobil (2025), the plaintiffs’ argument relied heavily on attribution studies linking increased hurricane intensity and flooding in the Northeast to climate change. While the case is ongoing, the judge allowed the attribution evidence to be heard, setting a precedent.
- Private Sector Adoption: Reinsurance giants like Swiss Re and Munich Re now incorporate attribution science into their catastrophe models to price climate risk more accurately for insurance products.
Success Stories: Attribution in Action
Case Study 1: The 2021 Pacific Northwest “Heat Dome”
This event was a landmark. Temperatures reached 49.6°C (121.3°F) in Lytton, British Columbia, a town that later burned in a wildfire. A WWA study published just weeks later concluded the event would have been “virtually impossible” without human-caused climate change. The intensity of the heatwave was made about 2°C hotter by climate change. This study, with its stark language, made global headlines and was cited by Canadian officials in debates over increased climate funding and heat action plans. It demonstrated the power of rapid, unequivocal communication.
Case Study 2: 2022 Pakistan Floods
Catastrophic flooding submerged a third of Pakistan, affecting 33 million people. A subsequent WWA study found that the 5-day maximum rainfall in the worst-hit regions was up to 50% more intense than it would have been in a world 1.2°C cooler. Climate change likely increased the total rainfall by 75%. This scientific evidence became a cornerstone of Pakistan’s diplomatic campaign for Loss and Damage funding at COP27 and COP28, moving the issue from moral appeal to evidence-based claim.
Case Study 3: The 2024 Drought in the Paraná River Basin (South America)
A multi-year drought devastated agriculture and hydropower in Brazil and Argentina. An attribution consortium led by Latin American scientists found that climate change, while not the initial cause of the drought (linked to La Niña), significantly increased its severity by raising temperatures and thus evaporation. This nuanced finding—climate change exacerbating a naturally occurring event—was crucial for water managers and farmers understanding the new risk landscape and planning for “hotter droughts.”
Real-Life Examples: The Science of Specific Disasters

- Hurricane Harvey’s Rainfall (2017): Multiple studies found that climate change increased Harvey’s record-breaking rainfall by at least 15-20%, and the probability of such an extreme rainfall event by roughly threefold. This was a classic demonstration of the Clausius-Clapeyron relationship.
- 2023 Mediterranean Storm Daniel & Libya Floods: Attribution studies focused on the sea surface temperature conditions that fueled the storm’s moisture load. Preliminary 2024 findings indicated that climate change made the sea surface temperatures that fueled the storm’s intensity far more likely, though the complex dynamics of the storm itself made a direct rainfall attribution more challenging.
- The UK’s 2020 Absence of Frost Days: In a creative example, scientists attributed the lack of an extreme event. They found that the record-low number of frost days in the UK in 2020 was made about 50 times more likely by climate change, showing its pervasive influence on all aspects of weather.
- Coral Bleaching Events: Marine scientists now routinely attribute mass coral bleaching events to anthropogenic ocean warming. For the 2024 Great Barrier Reef bleaching, scientists stated that without climate change, the sea surface temperatures required for such widespread bleaching would have been statistically impossible.
Conclusion and Key Takeaways: A New Era of Climate Understanding
Climate attribution science has irrevocably changed our relationship with the weather. It has provided the analytical rigor to move from saying “this is what climate change looks like” to “this is how much worse climate change made it.” This quantification is a game-changer for accountability, planning, and public understanding.
Key Takeaways for Beginners and Professionals:
- It’s Probabilistic, Not Deterministic: Attribution quantifies the change in odds or intensity, not direct causation. Think “loaded dice,” not “remote control.”
- Not All Events Are Equal: Heatwaves are the clearest signal; extreme rainfall is increasingly clear; for some complex events like tornadoes, the signal remains elusive.
- Speed and Transparency are Revolutionary: Rapid attribution provides scientifically robust answers while the event is still in public consciousness, cutting through misinformation.
- A Tool for Justice and Adaptation: This science is feeding directly into courtrooms, policy debates on Loss and Damage, and the redesign of our infrastructure for a hotter world.
- The Science Will Improve: As models get better and observational records longer, attribution will become more precise, local, and able to tackle compound events.
In a world where climate impacts are ceasing to be future projections and becoming present-day disasters, attribution science is the essential lens that brings the cause into focus. It tells us not just that the weather is changing, but precisely how and how much we are responsible—and therefore, what we must do to prepare, adapt, and ultimately, mitigate. For more on how focused efforts can drive change, explore the work featured in our Nonprofit Hub.
FAQs (Frequently Asked Questions)
- Q: How quickly can an attribution study be done?
- A: Rapid attribution studies, like those by WWA, aim for a 1-4 week timeframe from event end to published, peer-reviewed result. This requires pre-established methodologies, model access, and a dedicated team. More detailed studies can take months to a year.
- Q: What’s the difference between “weather” and “climate” in this context?
- A: Weather is the state of the atmosphere at a specific time and place (e.g., today’s storm). Climate is the long-term average (30+ years) of weather. Attribution science uses climate models and statistics to determine how human-altered climate (the long-term averages) changed the odds or severity of a specific weather event.
- Q: Can attribution be done for cold snaps or snowy winters?
- A: Yes, but it’s more complex. A key area of research is attributing changes in atmospheric circulation (like the polar vortex) that can lead to extreme cold in some regions even as the globe warms. Generally, climate change is making severe cold snaps less frequent and less severe, but specific events can still occur due to natural variability.
- Q: How do scientists create a “world without climate change”?
- A: They run climate models with atmospheric greenhouse gas concentrations fixed at pre-industrial levels (e.g., ~285 ppm CO2 instead of ~420 ppm). They also often remove the historical warming trend from observational data statistically, to create a counterfactual observational record.
- Q: Are there events that have been found to have no link to climate change?
- A: Yes. For example, a 2014 study on the UK’s wet winter of 2013/14 found no detectable influence of climate change. A 2020 study on a drought in Botswana and Namibia also found no clear attributable signal. Reporting these “null” results is a sign of scientific integrity.
- Q: How certain are these studies? What does “confidence” mean?
- A: They use standard statistical confidence levels (e.g., 95%). Certainty is assessed by the agreement between models, the clarity of the physical mechanism, and the observational trend. A result might be: “We are 95% confident that climate change made this event at least 2x more likely.” The confidence is explicitly stated in good studies.
- Q: Could natural cycles like El Niño be confused for climate change?
- A: This is a critical part of the analysis. Scientists explicitly account for known natural variability modes like El Niño-Southern Oscillation (ENSO), the North Atlantic Oscillation (NAO), and volcanic aerosols in their models and statistical methods. They aim to isolate the signal of human-induced greenhouse warming from this background noise.
- Q: Is attribution used in real-time disaster forecasting?
- A: Not yet for specific event forecasts, but it’s moving in that direction. Some groups are developing “forecast attribution“—assessing how climate change is altering the odds of an extreme event predicted to occur in the coming week or season.
- Q: Who funds attribution science?
- A: It’s funded by a mix of government research grants (e.g., from NOAA, NSF, EU), philanthropic organizations (e.g., the Rockefeller Foundation supports WWA), and academic institutions. Maintaining scientific independence is paramount, and reputable groups disclose all funding sources.
- Q: Can I request an attribution study for an event in my area?
- A: Research groups set their own priorities based on scientific interest, severity, and data availability. While you can’t typically “commission” one, advocacy groups and media outlets often suggest events to consortia like WWA. The decisions are made by scientists.
- Q: How does urban heat island effect play into heatwave attribution?
- A: This is carefully considered. Attribution studies focus on large-scale temperature changes due to climate change. The urban heat island is a local, land-use effect. Scientists use regional observations and models that may or may not fully resolve cities, and they are careful to separate the signals in their analysis and communication.
- Q: What’s the smallest scale an attribution can be done on?
- A: Currently, most studies focus on regions (e.g., Western Europe, Central US). However, high-resolution models and dense observational networks are allowing for attribution of events at the city or even sub-city scale, especially for heatwaves.
- Q: How does attribution relate to the IPCC reports?
- A: The IPCC synthesizes thousands of studies, including attribution research. The confident statements in the latest IPCC report about human influence on extremes (heat, rain, drought) are built upon the body of evidence from attribution science. The IPCC provides the big picture; attribution provides the specific case studies.
- Q: Has attribution science changed how we define a “100-year storm”?
- A: Absolutely. In a non-stationary climate, historical data is no longer a reliable guide. A “1-in-100-year” rainfall event may now be a “1-in-25-year” event due to climate change. Attribution studies help quantify this shift, prompting engineers and planners to update their design standards using climate-informed probabilities.
- Q: What is “single-event attribution” vs. “long-term trend attribution”?
- A: Single-event attribution asks about a specific event (2025 European heatwave). Long-term trend attribution asks about the change in frequency/severity of a class of events over decades (are European heatwaves becoming more frequent?). They use similar methods, but the former is more challenging and focuses on a specific data point.
- Q: Can attribution tell us about the future?
- A: Indirectly, yes. By confirming that models correctly simulate how climate change alters extremes today, it increases our confidence in their projections for tomorrow. It also shows us the “emergent” signals we can expect to strengthen with further warming.
- Q: What are the main limitations of attribution science?
- A: 1) Data scarcity in some regions (Africa, polar areas). 2) Model limitations in simulating some complex, small-scale phenomena. 3) Difficulty attributing compound/cascading events (drought + heat + fire). 4) The inherent probabilistic nature can be misunderstood by the public seeking binary yes/no answers.
- Q: How is machine learning being used?
- A: ML is used to: Pattern recognition in climate data to find event analogues. Speeding up model emulation (creating fast, approximate versions of slow climate models). Analyzing large datasets from observations and models to detect signals more efficiently.
- Q: Is there an international standard for how to do attribution?
- A: There is no single mandated standard, but there is a strong community-developed methodology followed by leading groups (WWA, EUCLEIA). Key principles include using multiple models/lines of evidence, assessing confidence, and peer review. The IPCC provides overarching guidance on assessing evidence.
- Q: Where can I find the latest attribution studies?
- A: Key sources:
- World Weather Attribution (WWA) website: Publishes all its rapid studies.
- Climate Central’s “World Weather Attribution” map tool.
- Bulletin of the American Meteorological Society (BAMS) annual “Explaining Extreme Events” special issue.
- Academic Journals: Nature Climate Change, Environmental Research: Climate, Science Advances.
- A: Key sources:
About Author
Sana Ullah Kakar is a climate physicist and science journalist specializing in extreme events and risk communication. They have collaborated with attribution science teams to translate complex methodologies into narratives that inform public policy and corporate strategy. With a background in computational modeling, they are passionate about demystifying the data behind the headlines. Their work is driven by the belief that clear, evidence-based understanding of climate risk is the first step toward resilience. This article is part of World Class Blogs’ commitment to frontier science in our Our Focus category. To join the conversation or suggest topics, visit our Contact Us page.
Free Resources
- World Weather Attribution (WWA): The leading source for rapid attribution studies, with clear summaries and full scientific reports. (Website: worldweatherattribution.org)
- Climate Central’s Attribution Map: An interactive tool showcasing key attribution studies around the world. (Website: climatecentral.org/climate-matters/attribution-map)
- IPCC Interactive Atlas: Allows users to explore observed and projected changes in climate extremes, providing context for attribution. (Website: interactive-atlas.ipcc.ch)
- Red Cross Red Crescent Climate Centre: “Science for Humanitarian Action” – Resources on using attribution in disaster response. (Website: climatecentre.org)
- National Academies of Sciences, Engineering, and Medicine Report: “Attribution of Extreme Weather Events in the Context of Climate Change” (2016). A foundational, accessible report on the science. (Free PDF available)
Discussion
Attribution science forces us to confront responsibility. Has reading about specific, quantified links changed your perception of recent extreme weather events in your region? Do you think this science will lead to greater political action or more effective climate litigation? What ethical questions does it raise about liability for climate damages? Share your thoughts, personal experiences with extreme weather, and further questions in the comments below. For insights into building resilient systems in a volatile world, our partners offer deep dives into business partnership models and global supply chains.


