The State of Climate Action 2025: Are We on Track for 1.5°C?
Comprehensive 2025 assessment of global climate action progress across all sectors, evaluating current trajectory against 1.5°C goals and identifying acceleration opportunities. climate action 2025, 1.5°C target, climate progress, emissions gap, climate trajectory, Paris Agreement, climate assessment, climate tracking, net-zero progress, critical decade, 1.5°C target, climate progress, emissions gap, climate trajectory, Paris Agreement implementation, state of climate action, climate action tracking, climate goals, net-zero pathways, critical decade, are we on track for 1.5 degrees, current state of climate action 2025, climate progress assessment, emissions reduction trajectory, Paris Agreement progress 2025.
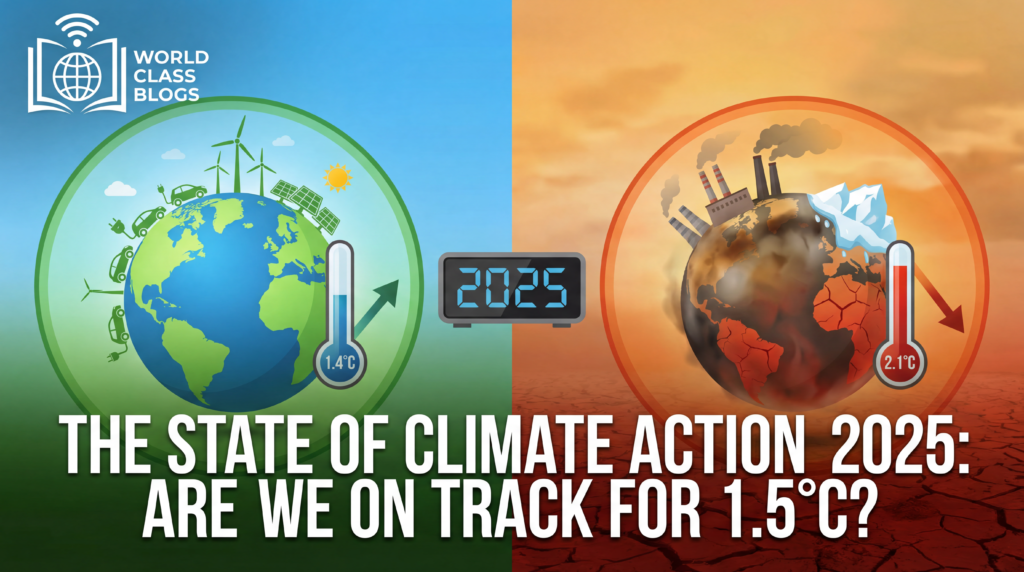
Current policies put the world on track for approximately 2.7°C warming, while enhanced action could align with Paris Agreement temperature goals.
Introduction – Why Tracking Climate Action Matters Now More Than Ever
As we approach the midpoint of the critical decade for climate action, understanding our current trajectory isn’t merely an academic exercise—it’s an urgent necessity for shaping policy decisions, investment strategies, and global cooperation. The year 2025 represents a crucial checkpoint in humanity’s climate journey, marking ten years since the Paris Agreement and the deadline for new nationally determined contributions that will determine whether we can still limit warming to 1.5°C. For curious beginners and professionals seeking a quick refresher, grasping our current position relative to climate goals provides essential context for evaluating policies, technologies, and institutional responses.
In my experience analyzing climate policy implementation across multiple sectors and regions, what I’ve found most striking is the uneven pace of transformation—rapid progress in some areas contrasting with stubborn stagnation in others. This divergence creates both opportunities and challenges: successes demonstrate what’s possible and can be scaled, while lagging sectors reveal where additional focus and innovation are needed. Understanding this complex landscape helps identify leverage points where accelerated action could yield disproportionate benefits.
The 1.5°C target, once considered aspirational, has become the scientific and moral benchmark for climate action, as research increasingly reveals substantial differences in impacts between 1.5°C and 2°C of warming. With current policies putting the world on track for approximately 2.7°C of warming by century’s end, the gap between trajectory and target defines the scale of our collective challenge. This comprehensive assessment examines where we stand, how we got here, and what must change to align our path with our proclaimed goals.
Background / Context: The 1.5°C Target and Its Significance
Scientific Foundations of the 1.5°C Limit
The 1.5°C warming limit emerged from scientific assessment rather than political negotiation, though it gained political traction through the Paris Agreement’s call to “pursue efforts” toward this more ambitious target. The IPCC’s Special Report on Global Warming of 1.5°C, published in 2018, provided the comprehensive scientific basis, revealing that half a degree matters profoundly for ecosystems and human systems. At 2°C warming versus 1.5°C: coral reefs would be virtually eliminated rather than degraded; Arctic sea ice would disappear completely most summers rather than once per century; hundreds of millions more people would be exposed to climate-related risks and poverty.
These differential impacts made 1.5°C not just a numerical target but a boundary separating substantially different climate futures. The report also clarified that limiting warming to 1.5°C requires reaching net-zero CO2 emissions around 2050, with rapid reductions in non-CO2 greenhouse gases. This scientific foundation transformed the political significance of 1.5°C, particularly for vulnerable nations and communities for whom the difference represents existential implications. Understanding this scientific context is essential for appreciating why 1.5°C has become the benchmark against which climate action is measured.
The Paris Agreement Architecture and Ambition Cycles
The Paris Agreement’s institutional design created mechanisms for regularly assessing and enhancing climate action through nationally determined contributions submitted every five years. The agreement established a “ratchet mechanism” whereby each round of NDCs should represent a progression beyond previous commitments, theoretically creating a cycle of increasing ambition. The year 2025 represents the next major milestone in this cycle, with new NDCs due that should reflect lessons from implementation and the first Global Stocktake.
This institutional architecture recognizes that initial Paris commitments were collectively insufficient for 1.5°C—representing what was politically feasible in 2015 rather than what was scientifically necessary. The agreement’s value lies in creating processes to close this gap over time through iterative improvement. The 2023 Global Stocktake provided the most comprehensive assessment to date of collective progress, concluding that much stronger action is needed across all sectors and regions. The 2025 NDCs represent the next opportunity to translate this assessment into enhanced commitments.
The Critical Decade Framework
Climate scientists emphasize that emissions reductions this decade disproportionately influence long-term warming due to the cumulative nature of CO2 in the atmosphere and the long lifetimes of energy infrastructure. The 2020s have been termed the “critical decade” because decisions made during this period will largely determine whether 1.5°C remains achievable. Delaying action necessitates steeper, more expensive reductions later and increases reliance on unproven carbon removal at scale.
This temporal dimension creates particular urgency for mid-decade assessment in 2025. By this point, approximately half the critical decade will have passed, providing sufficient implementation experience to evaluate trajectories while leaving time for course correction. Understanding this temporal logic helps explain why 2025 represents such an important checkpoint—not just another year in climate diplomacy but a crucial moment for evaluating whether we’re leveraging the critical decade effectively or squandering it.
Key Concepts Defined: Understanding Climate Action Metrics
The Emissions Gap and Implementation Gap
Climate action assessments typically distinguish between the emissions gap (difference between projected emissions under current policies and emissions consistent with temperature goals) and the implementation gap (difference between commitments and policies actually in place). The emissions gap represents the aggregate result of insufficient action, while the implementation gap reveals where specific policies or measures fall short of what’s been pledged.
As of 2025, the emissions gap remains substantial: current policies put the world on track for approximately 2.7°C of warming, while full implementation of all NDCs and pledges (including conditional ones) would reduce this to about 2.4°C—still well above the 1.5°C target. The implementation gap varies by country and sector, with some jurisdictions exceeding their commitments while others lag significantly. Understanding these distinct gaps helps identify different types of challenges: strengthening ambition versus improving implementation of existing commitments.
Sectoral Transformation Pathways
Comprehensive climate action requires transformation across multiple interconnected sectors: energy supply (decarbonizing electricity generation), transportation (shifting to zero-emission vehicles and modes), buildings (improving efficiency and electrifying heating), industry (adopting new processes and materials), agriculture and land use (reducing emissions while enhancing carbon sinks). Each sector has different technological options, cost profiles, transition timelines, and governance challenges.
Sectoral analysis reveals highly uneven progress: rapid transformation in electricity generation (with renewables becoming the cheapest new power source in most markets) contrasts with slower progress in harder-to-abate sectors like heavy industry, aviation, and agriculture. This unevenness has implications for overall pathways to 1.5°C, as the most challenging sectors may determine the pace and feasibility of the overall transition. Understanding sector-specific dynamics helps identify where breakthroughs are most urgently needed.
Carbon Budgets and Temporal Implications
The concept of a remaining carbon budget quantifies how much CO2 can still be emitted while keeping warming below specific temperature limits with defined probability. Estimates vary based on methodological choices and updated scientific understanding, but the IPCC’s 2021 assessment suggested a remaining budget of approximately 500 gigatonnes of CO2 for a 50% chance of limiting warming to 1.5°C. At current emission rates of about 40 gigatonnes annually, this budget would be exhausted in roughly 12 years.
This budgetary framework creates temporal urgency and highlights the consequences of delay. Each year of current emissions reduces the remaining budget, necessitating steeper future reductions to stay within the same temperature limit. The carbon budget concept translates abstract temperature goals into concrete emission constraints, emphasizing that climate action isn’t just about direction but also about pace and cumulative totals. Understanding this budgetary logic is essential for evaluating whether current action aligns with long-term goals.
How Climate Action Is Tracking: A Sector-by-Sector Analysis

Energy Supply Transformation
The power sector represents both the largest source of emissions and the area of most rapid transformation. Renewable energy capacity additions continue to break records, with solar and wind now the cheapest sources of new electricity generation in most markets. In 2024, renewables accounted for approximately 90% of new power capacity globally, continuing a trend of consistent growth. However, this rapid expansion must accelerate further to align with 1.5°C pathways, which typically require roughly tripling renewable capacity by 2030 compared to 2022 levels.
The transformation extends beyond generation to grid modernization and flexibility. As renewable penetration increases, electricity systems require enhanced transmission, demand response, storage, and grid management capabilities. Progress in these enabling dimensions has been mixed, with some regions developing comprehensive grid modernization strategies while others lag. Additionally, fossil fuel phase-out remains inconsistent, with coal power declining in most developed countries but expanding in some developing regions, and gas infrastructure continuing to grow despite climate implications.
Transportation Electrification and Modal Shift
The transport sector has seen accelerating electrification, particularly in light-duty vehicles where electric models reached approximately 18% of global new car sales in 2024. This represents exponential growth from just 2-3% five years earlier, demonstrating how technological improvement, policy support, and consumer acceptance can combine to drive rapid transformation. However, alignment with 1.5°C requires this acceleration to continue, reaching approximately 60% of new sales by 2030.
Beyond passenger vehicles, transformation faces greater challenges: heavy trucks, aviation, and shipping require different technological solutions, with hydrogen, advanced biofuels, and synthetic fuels under development but not yet cost-competitive at scale. Equally important but often neglected is modal shift toward public transit, walking, and cycling—particularly in rapidly urbanizing regions where infrastructure decisions today will lock in transport patterns for decades. Progress here has been geographically uneven, with some cities making substantial investments while others continue auto-centric development.
Building Decarbonization and Efficiency
The buildings sector presents particular challenges due to long infrastructure lifetimes, split incentives between builders and occupants, and the diversity of building types and climates. Progress on energy efficiency has been steady but insufficient, with global building energy intensity improving by approximately 1.5% annually—below the 3% needed for 1.5°C alignment. Building electrification for heating and cooking is advancing, particularly in regions with supportive policies, but fossil fuel systems continue to dominate new installations in many areas.
The renovation rate of existing buildings remains a critical bottleneck, currently below 1% annually in most regions versus the 2-3% needed for climate alignment. This slow pace reflects both economic barriers (high upfront costs, split incentives) and behavioral factors (inconvenience, lack of awareness). Building codes have strengthened in many jurisdictions but often exempt existing buildings and lack robust enforcement. Addressing these challenges requires policy packages combining standards, incentives, information, and capacity building.
Industrial Transformation and Circular Economy
Heavy industry (cement, steel, chemicals) represents perhaps the most challenging decarbonization frontier due to process emissions, high-temperature heat requirements, long capital cycles, and trade exposure. While some breakthrough technologies (hydrogen-based steel, carbon capture for cement) have reached pilot or early commercial stages, widespread deployment remains years away. Current progress is largely incremental efficiency improvements rather than transformational technology adoption.
The circular economy offers complementary emissions reductions through material efficiency, recycling, and product longevity. Progress here has been piecemeal, with some jurisdictions implementing extended producer responsibility, recycling mandates, or design standards, but lacking comprehensive systemic approaches. The industrial transition illustrates a broader pattern in climate action: solutions exist in theory or at pilot scale, but scaling them requires coordinated action on technology development, infrastructure investment, market creation, and policy alignment.
Agriculture, Forestry, and Land Use
The AFOLU sector presents unique challenges and opportunities, being both a significant emissions source and a potential carbon sink. Deforestation, particularly in tropical regions, continues at alarming rates despite international commitments, with an area roughly the size of Portugal cleared annually. Agricultural emissions from livestock, fertilizers, and soil management have proven stubbornly resistant to reduction, increasing approximately 14% since 2000.
Conversely, nature-based solutions offer significant mitigation potential through forest restoration, improved agricultural practices, and coastal ecosystem protection. Progress here has been geographically uneven, with some regions implementing effective conservation and restoration programs while others continue ecosystem degradation. The sector illustrates how climate action intersects with complex issues of rural livelihoods, land rights, food security, and biodiversity—requiring integrated approaches rather than narrowly focused emissions reduction strategies.
Why Our Current Trajectory Matters: Consequences of Success or Failure
Near-Term Lock-In and Path Dependency
Climate action during the 2020s creates substantial path dependency through infrastructure investments that will operate for decades. Power plants built today typically operate for 30-50 years; industrial facilities for 20-40 years; buildings for 50-100 years; transportation systems shape urban form for generations. Decisions made during this critical decade therefore, determine whether we’re building zero-carbon infrastructure or locking in high emissions for decades.
This lock-in effect means that delayed action has compounding consequences. Each year of insufficient climate policy results in more long-lived high-carbon infrastructure being built, requiring either premature retirement (with economic costs) or continued operation (with emissions consequences). Understanding this temporal dimension helps explain the urgency of accelerating action now rather than waiting for perfect solutions—the infrastructure we build today will largely determine our emissions trajectory for decades.
Economic Competitiveness in a Transitioning World
The pace of national climate action increasingly influences economic competitiveness in emerging clean technology markets. Countries and companies that lead in developing and deploying low-carbon technologies capture market share, intellectual property, and supply chain advantages. As more jurisdictions implement climate policies and carbon border adjustments, production processes with higher emissions face increasing competitive disadvantages.
This economic dimension creates diverging national interests in the pace of global transition. Countries with strong clean technology sectors may benefit from more rapid global action, while resource-dependent economies face transition risks. These differing economic interests shape international negotiations and national policy ambitions. Understanding these economic dynamics helps explain why some countries accelerate climate action beyond what global equity considerations might suggest while others resist more ambitious commitments.
Adaptive Capacity and Loss Escalation
The pace of emissions reduction directly influences the scale of climate impacts to which societies must adapt. Slower mitigation means higher eventual warming, requiring more extensive and expensive adaptation measures. Some impacts, particularly on ecosystems and through sea-level rise, become increasingly irreversible beyond certain thresholds. The difference between 1.5°C and higher warming pathways represents substantially different adaptation challenges and residual losses.
This connection between mitigation pace and adaptation burden creates compound urgency. Delayed mitigation not only increases long-term warming but reduces the time available for planned adaptation, potentially forcing more reactive, less effective responses. Particularly for vulnerable communities and ecosystems with limited adaptive capacity, the pace of global mitigation directly determines their exposure to unmanageable risks. This equity dimension highlights how mitigation delays disproportionately affect those least responsible for emissions.
Sustainability in the Future: Bridging the Gap to 1.5°C
Accelerating Existing Solutions Through Policy and Investment
The most immediate opportunity for closing the emissions gap involves accelerating deployment of already cost-effective solutions through enhanced policies and redirected investment. Renewable energy, energy efficiency, and electrification of end-uses already make economic sense in many applications but face persistent barriers: outdated regulations, lack of enabling infrastructure, information gaps, and misaligned incentives. Addressing these barriers through comprehensive policy packages could significantly accelerate progress.
This acceleration requires not just individual policies but policy coherence across different government levels and sectors. Inconsistent signals—such as subsidizing fossil fuels while promoting renewables, or investing in electric vehicles while expanding road infrastructure that induces driving—undermine transition momentum. Developing integrated policy frameworks that align incentives across the economy represents a crucial governance challenge for the remainder of the critical decade.
Fostering Innovation in Hard-to-Abate Sectors
While existing solutions can address much of the emissions reduction needed this decade, achieving long-term net-zero goals requires breakthroughs in harder-to-abate sectors: aviation, shipping, heavy industry, and carbon removal. These technologies currently exist at various stages of development, from laboratory research to pilot projects, but require substantial support to reach commercial viability and scale. The innovation challenge involves both technical development and creating initial markets for emerging solutions.
Effective innovation systems require public-private collaboration, with governments funding basic research and early-stage development while creating demand through procurement, standards, and carbon pricing. The current innovation landscape shows promising activity but insufficient scale and coordination to ensure technologies will be available when needed. Strategic focus on critical technology gaps, coupled with mechanisms to drive down costs through learning and scale, represents an essential component of bridging to 1.5°C.
Strengthening International Cooperation and Finance Flows
The global nature of climate change necessitates coordinated international action, particularly to support developing countries in pursuing low-carbon development pathways. Current climate finance flows remain insufficient, particularly for adaptation, and often come with burdensome conditions that limit accessibility. The commitment to mobilize $100 billion annually, while symbolically important, represents a fraction of the trillions needed for global transition.
Enhanced international cooperation could also address competitive concerns that sometimes inhibit ambitious national action. Mechanisms like carbon border adjustments, international technology partnerships, and sectoral agreements can create level playing fields while preventing carbon leakage. The effectiveness of these cooperation mechanisms will significantly influence whether national actions sum to sufficient global ambition or whether concerns about fairness and competitiveness constrain collective progress.
Common Misconceptions About Climate Progress
“We’re Making Good Progress Overall”
While certain indicators show encouraging trends—particularly renewable energy growth and electric vehicle adoption—aggregate emissions continue to rise, reaching new record levels annually. The “good progress” narrative often highlights positive developments in specific sectors or regions while neglecting the overall emissions trajectory and remaining gap to climate goals. This selective attention can create unwarranted complacency about the adequacy of current action.
A more accurate assessment recognizes divergent trends: rapid progress in some areas (electricity, passenger vehicles) but stagnation or backsliding in others (deforestation, industrial emissions, agricultural emissions). The overall challenge involves accelerating progress in leading sectors while overcoming barriers in lagging ones. A balanced assessment acknowledges successes while maintaining focus on the substantial acceleration still required across the board.
“Technology Will Solve Everything”
The techno-optimist narrative assumes that innovation will inevitably deliver solutions that make deep emissions reductions easy and inexpensive. While technological progress has indeed exceeded expectations in some areas (solar costs, battery performance), it has lagged in others (carbon capture, industrial processes). More fundamentally, technology deployment faces non-technical barriers: economic incentives, institutional resistance, behavioral patterns, and political opposition.
This misconception underestimates the socio-technical nature of energy transitions, which involve not just hardware but also markets, regulations, business models, and user practices. Successful transitions require parallel innovation in these social and institutional dimensions alongside technological development. Assuming technology alone will solve climate change risks neglecting the policy, investment, and behavioral changes equally essential for transformation.
“Developing Countries Are the Problem”
A persistent narrative in some developed countries attributes insufficient climate progress to rising emissions in developing economies, particularly China and India. While these countries now account for substantial emissions, this framing neglects historical responsibility, per capita emissions, and the development context. Developed countries, with approximately 16% of global population, have contributed approximately 60% of historical CO2 emissions since the Industrial Revolution.
More importantly, this narrative overlooks substantial climate action in developing countries: China leads the world in renewable energy deployment; India has achieved remarkable solar cost reductions; numerous developing countries maintain lower per capita emissions than developed nations despite pursuing poverty reduction. Effective global action requires cooperation based on differentiated responsibilities and capabilities, not blame attribution that undermines collective effort.
“Individual Action Is Insignificant”
The individual/systemic false dichotomy suggests that only systemic policy changes matter, rendering individual behavior irrelevant. In reality, individual actions contribute directly to emissions (households account for approximately 60-70% of emissions through consumption choices) and indirectly by shaping social norms, creating markets for low-carbon products, and building political support for stronger policies. Systemic and individual action reinforce each other in successful transitions.
This misconception also ignores how distributed technologies (solar panels, electric vehicles, smart thermostats) make individuals active participants in energy system transformation. As energy systems become more decentralized, the aggregation of individual choices increasingly influences overall system outcomes. Rather than dismissing individual action, effective climate strategies should connect personal choices with systemic change through information, infrastructure, and incentives.
Recent Developments (2024-2025)
Enhanced NDCs Under Preparation
The period leading to 2025 involves intensive national climate planning as countries prepare new or updated nationally determined contributions. Early indications suggest substantial variation in enhancement ambition: some countries are conducting comprehensive sectoral analyses to identify additional mitigation potential, while others appear constrained by political or economic factors. The quality of these NDCs—not just their headline targets but their policy specificity, implementation plans, and transparency—will significantly influence overall progress.
Particular attention focuses on major emitters representing approximately 80% of global emissions: China, United States, European Union, India, Russia, Japan, Brazil, Indonesia, Iran, and South Korea. Their collective ambition will largely determine whether the 2025 NDC cycle substantially narrows the emissions gap or represents incremental improvement insufficient for 1.5°C alignment. Early announcements suggest some enhancement but likely falling short of what scientific assessments indicate is necessary.
Sectoral Breakthroughs and Setbacks
Recent developments reveal continued divergent sectoral trajectories. Renewable energy maintains rapid growth, with solar installations again breaking records in 2024. Electric vehicle sales continue exponential growth, though from a low base in many regions. Conversely, deforestation persists despite international commitments, with some regions showing increased clearing rates. Industrial emissions continue gradual increase as efficiency gains are offset by production growth.
These divergences highlight how transition momentum varies by sector based on technology readiness, policy attention, and economic incentives. The positive developments demonstrate what’s possible with favorable conditions, suggesting that similar acceleration could occur in lagging sectors with appropriate interventions. The contrasting trajectories also indicate where additional policy focus and innovation are most urgently needed to achieve comprehensive transformation.
Climate Finance Landscape Evolution
Climate finance continues to evolve, with public and private flows increasing but remaining insufficient for comprehensive transition, particularly in developing countries. The $100 billion annual goal, while symbolically important, represents a small fraction of needs estimated in the trillions. More significant than the total amount are the allocation (mitigation versus adaptation), accessibility (grant versus loan terms), and effectiveness (additionality, alignment with national priorities).
Recent developments include growth in blended finance mechanisms that use public funds to catalyze private investment, expansion of sustainability-linked bonds and loans, and experimentation with innovative instruments like debt-for-climate swaps. However, access remains uneven, with least developed countries and small island states particularly disadvantaged despite facing the most severe climate impacts. The effectiveness of climate finance will significantly influence developing country capacity to enhance their climate actions.
Success Stories: Demonstrating Accelerated Transition Potential
Renewable Energy Leadership in Multiple Regions
Several regions demonstrate how a rapid energy transition is achievable with supportive policies and market conditions. The European Union generated approximately 45% of its electricity from renewables in 2024, with several member states exceeding 70%. Uruguay transformed its electricity system from fossil fuel dependence to 98% renewables in under 15 years through consistent policy, technological neutrality, and public-private collaboration. Scotland now generates approximately 100% of its electricity from renewables, though still connected to the broader UK grid.
These examples demonstrate that high renewable penetration is technically feasible and economically beneficial when supported by comprehensive strategies addressing not just generation but also grid integration, flexibility, and enabling policies. They provide real-world evidence countering claims about inherent technical limitations or prohibitive costs. While specific circumstances vary, the common elements—long-term policy certainty, technological openness, stakeholder engagement—offer transferable insights.
Electric Vehicle Market Transformation
Norway’s electric vehicle transition represents perhaps the most dramatic transportation transformation, with approximately 90% of new car sales being electric in 2024, up from negligible levels just a decade earlier. This achievement resulted from a comprehensive policy package including purchase incentives, tax advantages, charging infrastructure investment, and access privileges (bus lanes, parking, toll exemptions). While Norway’s specific circumstances (high income, hydroelectric resources) aren’t universally applicable, the policy approach offers transferable lessons.
More broadly, the global electric vehicle market has grown exponentially, with sales increasing approximately tenfold over the past five years. This growth demonstrates how technological improvement, policy support, and market formation can combine to drive rapid transformation. While challenges remain—particularly in heavy transport and charging infrastructure equity—the passenger vehicle transition shows that rapid change is possible when multiple drivers align.
Industrial Decarbonization Initiatives
While heavy industry presents particular challenges, some corporate and national initiatives demonstrate progress. Sweden’s HYBRIT project produced the world’s first fossil-free steel in 2021 using hydrogen instead of coal, with commercial production planned by 2026. Several cement companies have implemented carbon capture pilots, with the first commercial-scale facility beginning operation in 2024. These initiatives, while not yet at scale, demonstrate technological feasibility and provide learning opportunities for broader deployment.
These industrial examples highlight the importance of first movers and demonstration projects in hard-to-abate sectors. While current impact remains limited, they establish technological proof points, identify implementation challenges, and begin building necessary supply chains and regulatory frameworks. Their success—or failure—will significantly influence whether comprehensive industrial transition is achievable within climate-relevant timeframes.
Real-Life Examples: National and Subnational Climate Action
Germany’s Energiewende Evolution
Germany’s energy transition policy, initiated in 2010, aimed to simultaneously phase out nuclear power, expand renewables, improve efficiency, and reduce emissions. The policy has achieved significant results despite challenges: renewable electricity share increased from about 17% in 2010 to over 50% in 2024; coal use declined substantially; and emissions fell by about 42% from 1990 levels despite nuclear phase-out. However, the transition has faced criticism for costs and implementation complexities.
Germany’s experience offers nuanced lessons: rapid renewable expansion is achievable but requires careful attention to system integration, cost distribution, and social acceptance. The policy’s evolution—with adjustments to address early challenges—exemplifies iterative improvement based on real-world experience. While specific policy instruments reflect German context, the broader approach of comprehensive, adaptive policy packages offers insights for other jurisdictions.
California’s Multi-Sector Climate Policy
California’s climate policy represents one of the most comprehensive subnational approaches, including cap-and-trade, renewable portfolio standards, zero-emission vehicle mandates, building efficiency codes, and multiple equity-focused programs. Despite having the world’s fifth-largest economy, California has reduced emissions approximately 14% from 2004 levels while growing GDP by over 40%. The state has maintained below-average unemployment and achieved faster clean technology adoption than national averages.
California’s experience demonstrates how policy packages can achieve multiple objectives simultaneously: emissions reductions, economic growth, technological innovation, and equity improvements. The state’s ability to decouple emissions from economic growth challenges assumptions about inevitable trade-offs. While California benefits from specific advantages (mild climate, innovation ecosystem), its policy innovations offer transferable insights about designing effective, politically sustainable climate action.
Rwanda’s Climate-Compatible Development
As a least developed country with minimal historical emissions, Rwanda has pursued climate action integrated with development objectives. The country has maintained one of Africa’s most ambitious climate targets, aiming for carbon neutrality by 2050 despite current low emissions. Rwanda has implemented comprehensive policies including forest restoration, renewable energy expansion, climate-resilient agriculture, and green urban development, with climate considerations integrated into national planning processes.
Rwanda’s approach exemplifies climate-compatible development that addresses mitigation, adaptation, and development simultaneously rather than sequentially. While facing implementation challenges common to low-income countries, Rwanda’s experience demonstrates that climate action need not await high income levels and can support rather than constrain development. This model offers insights for other developing countries navigating the dual challenge of poverty reduction and climate response.
Conclusion and Key Takeaways
As we reach the midpoint of the critical decade for climate action, our collective trajectory remains insufficient for limiting warming to 1.5°C but contains promising elements that could be accelerated to close the gap. The year 2025 represents both a sobering checkpoint and a crucial opportunity—sobering because current policies put us on track for approximately 2.7°C warming, but crucial because enhanced nationally determined contributions could substantially improve this trajectory.
Several key insights emerge from assessing the state of climate action:
First, progress is highly uneven across sectors and regions, with rapid transformation in electricity and passenger vehicles contrasting with slower progress in industry, agriculture, and building renovation. This unevenness suggests that successful strategies must be sector-specific, leveraging different policy instruments, innovation approaches, and timelines appropriate to each domain’s characteristics. One-size-fits-all approaches will likely fail to address this diversity of challenges.
Second, existing solutions can achieve substantial emissions reductions this decade if deployed at accelerated scale through enhanced policies and investment. The technologies for decarbonizing electricity, improving efficiency, and electrifying light transport are already cost-competitive in many applications. The primary barriers are often political and institutional rather than technical or economic, suggesting that removing these barriers could yield rapid progress.
Third, harder-to-abate sectors require parallel innovation efforts to ensure solutions are available when needed. While existing technologies can address much of the emissions reduction needed by 2030, achieving net-zero by mid-century requires breakthroughs in heavy industry, long-distance transport, and carbon removal. These innovation efforts must accelerate significantly to provide options at scale within relevant timeframes.
Fourth, equity considerations remain central to effective and legitimate climate action. Developing countries require enhanced support to pursue low-carbon development pathways, while vulnerable communities everywhere need protection from disproportionate transition costs. Climate policies that exacerbate inequality will face political resistance and ethical critique, undermining their sustainability and effectiveness.
Fifth, the 2025 NDC enhancement cycle represents a crucial inflection point. Countries’ willingness to significantly strengthen their commitments will largely determine whether 1.5°C remains achievable or recedes from reach. The quality of these NDCs—their specificity, implementability, and transparency—matters as much as their headline targets.
Finally, individual and collective actions reinforce each other in successful transitions. While systemic policy change is essential, individual choices shape markets, social norms, and political possibilities. Effective climate strategies should connect personal action with systemic change rather than treating them as competing alternatives.
The path from here to 1.5°C-aligned futures remains challenging but navigable with accelerated action across all sectors and regions. Success requires not just incremental improvement but transformational change in how we produce and consume energy, manage land, design cities, and organize economies. As we approach the 2025 checkpoint, the choices made by governments, businesses, investors, and citizens will collectively determine whether we seize this narrowing window of opportunity or consign ourselves to more dangerous climate futures.
Frequently Asked Questions
What is the current warming trajectory based on existing policies?
Based on current policies and their expected effects, the world is on track for approximately 2.7°C of warming by 2100 compared to pre-industrial levels. This represents substantial progress from earlier projections of 3-4°C warming but remains well above the Paris Agreement’s goals of “well below 2°C” and pursuing efforts toward 1.5°C.
How much do emissions need to fall by 2030 for 1.5°C alignment?
For a likely chance (approximately 67%) of limiting warming to 1.5°C, global greenhouse gas emissions need to fall by approximately 43% from 2019 levels by 2030. Current policies are projected to result in emissions increasing slightly rather than decreasing, creating a substantial gap between current trajectory and necessary reductions.
Which sectors are making the most progress on climate action?
The electricity sector shows the most rapid transformation, with renewable energy becoming the cheapest source of new power generation in most markets and accounting for approximately 90% of new capacity additions. Transportation is also progressing rapidly in some regions, with electric vehicle sales growing exponentially, though from a low base globally.
Which sectors are lagging in climate action?
Industry, buildings, and agriculture/land use are generally lagging behind needed transformation pathways. Industrial emissions continue gradual increase; building renovation rates remain below needed levels; deforestation continues despite international commitments. These harder-to-abate sectors require additional policy focus and innovation.
What is the “emissions gap” and how large is it?
The emissions gap refers to the difference between projected emissions under current policies and emissions consistent with temperature goals. For 1.5°C, the gap is approximately 20-23 gigatonnes of CO2 equivalent by 2030, meaning emissions need to fall about 40% more than current policies will achieve.
Are countries meeting their Paris Agreement commitments?
Implementation varies significantly by country. Some countries are on track to meet or exceed their nationally determined contributions, while others are lagging. Overall, full implementation of all unconditional NDCs would result in warming of approximately 2.4°C, suggesting that even met commitments are insufficient for Paris goals.
What are nationally determined contributions and why is 2025 important?
Nationally determined contributions are climate action plans that each country submits under the Paris Agreement, outlining emissions reduction targets and adaptation plans. Countries are supposed to submit new or updated NDCs every five years, with 2025 being the next submission deadline for enhanced commitments.
How does the 1.5°C target differ from 2°C in terms of impacts?
Substantial differences exist: at 2°C versus 1.5°C, coral reefs would be virtually eliminated rather than degraded; Arctic sea ice would disappear completely most summers rather than once per century; hundreds of millions more people would be exposed to climate-related risks and poverty. These differential impacts make the half-degree difference scientifically and morally significant.
What is the “critical decade” for climate action?
The 2020s are termed the critical decade because emissions reductions during this period disproportionately influence long-term warming due to the cumulative nature of CO2 and long infrastructure lifetimes. Decisions made during this decade will largely determine whether 1.5°C remains achievable or becomes infeasible.
How much climate finance is needed and how does current funding compare?
Developing countries need approximately $2.4 trillion annually in climate finance by 2030 for mitigation and adaptation, according to UN estimates. Current flows are approximately $600-800 billion annually from all sources (public and private), with only about $50 billion going to adaptation in developing countries—far below estimated needs.
What are “hard-to-abate” sectors and why are they challenging?
Hard-to-abate sectors include heavy industry (cement, steel, chemicals), long-distance transport (aviation, shipping), and some agricultural processes. They’re challenging because they involve high-temperature heat requirements, process emissions (not just energy emissions), trade exposure, long capital cycles, and in some cases limited technological alternatives.
How much renewable energy growth is needed for 1.5°C alignment?
For 1.5°C alignment, renewable energy capacity needs to triple from 2022 levels by 2030, reaching approximately 11,000 gigawatts globally. Current growth rates are roughly on track for this expansion, but acceleration is needed in some regions and for enabling infrastructure like transmission and storage.
What percentage of new cars sold need to be electric by 2030 for climate goals?
For 1.5°C alignment, approximately 60% of new light-duty vehicle sales globally need to be electric by 2030. Current trends show exponential growth but from a low base, reaching approximately 18% in 2024. Maintaining this growth rate would achieve the target, but requires continued policy support and infrastructure investment.
How fast do buildings need to be renovated for energy efficiency?
Global building renovation rates need to reach 2-3% annually for climate alignment, approximately double current rates in most regions. This acceleration requires addressing barriers like high upfront costs, split incentives between owners and occupants, and inconvenience during renovation.
Is carbon removal necessary for 1.5°C pathways?
Yes, all 1.5°C pathways in IPCC assessments include some carbon dioxide removal to offset residual emissions from hard-to-abate sectors and possibly create net-negative emissions later in the century. However, CDR cannot substitute for rapid emissions reductions and should complement rather than replace mitigation efforts.
How does deforestation affect climate goals?
Deforestation accounts for approximately 10% of global greenhouse gas emissions and reduces natural carbon sinks. Ending deforestation by 2030 is essential for 1.5°C pathways, yet deforestation continues at alarming rates despite international commitments like the Glasgow Leaders’ Declaration on Forests.
What are “just transitions” and why do they matter?
Just transitions refer to ensuring that climate policies support workers and communities affected by economic changes, create quality jobs, and address distributional impacts. They matter both ethically and politically—policies perceived as unfair face resistance that can undermine climate action.
How do carbon budgets work and how much remains for 1.5°C?
Carbon budgets quantify how much CO2 can still be emitted while keeping warming below specific limits with defined probability. For a 50% chance of 1.5°C, approximately 500 gigatonnes of CO2 remain from 2020 onward. At current emissions of about 40 gigatonnes annually, this budget would be exhausted in roughly 12 years.
What role do individuals play in climate action?
Individuals contribute through consumption choices (approximately 60-70% of emissions), political engagement, social norm influence, and as participants in distributed energy systems. While systemic change is essential, individual actions shape markets, demonstrate feasibility, and build political support for stronger policies.
Where can I find reliable information about climate progress?
Authoritative sources include IPCC assessment reports, IEA World Energy Outlook, UNEP Emissions Gap Report, Climate Action Tracker, World Resources Institute climate data platforms, and national greenhouse gas inventories. These provide evidence-based assessments of current trajectories and needed actions.
About the Author
This assessment was developed by climate policy analysts and data scientists specializing in tracking climate action across multiple sectors and jurisdictions. Our team includes former IPCC contributors, energy system modelers, and policy evaluation experts with decades of combined experience assessing climate progress against scientific benchmarks.
We believe that regular, rigorous assessment of climate action provides essential feedback for course correction in this critical decade. By tracking progress against scientifically-defined pathways, we aim to inform more effective policy development, investment decisions, and public discourse. Climate change presents an unprecedented challenge requiring unprecedented transformation—an honest assessment of where we stand is the first step toward determining how to accelerate progress.
Our approach emphasizes evidence-based analysis, sector-specific understanding, and contextual interpretation of data. We recognize that climate action occurs within complex socio-technical systems where progress depends on multiple interacting factors. Our assessments aim to provide not just data but insight into drivers of change and barriers to acceleration.
For more perspectives on tracking complex global challenges, explore related content on our platform, including analyses of global supply chain optimization and guides to building successful partnerships in evolving business landscapes.
Free Resources for Further Learning
- Climate Action Tracker: Independent scientific analysis tracking government climate action against Paris Agreement temperature goals with country-by-country assessments.
- IEA World Energy Outlook: Annual comprehensive analysis of global energy trends, including progress toward clean energy transitions and emissions reduction pathways.
- UNEP Emissions Gap Report: Annual assessment of the gap between anticipated emissions and levels consistent with the Paris Agreement temperature goals.
- World Resources Institute Climate Watch: Interactive data platform for exploring climate progress, emissions data, and policy implementation across countries and sectors.
- Climate Analytics Climate Action Monitor: Regular updates on the implementation of climate policies and their effectiveness in reducing emissions.
- NewClimate Institute Climate Policy Database: Comprehensive database of climate policies and measures across countries with implementation assessment.
- Our World in Data Climate Change Section: Data visualizations and explainers on climate indicators, emissions trends, and energy transitions.
For those interested in the psychological dimensions of engaging with global challenges, consider exploring this guide to psychological wellbeing which addresses how to maintain perspective and agency while confronting complex issues like climate change.
Discussion
The state of climate action raises important questions about measurement, acceleration, and equity:
How should we balance acknowledging progress with maintaining urgency for further action? Celebrating successes can build momentum and demonstrate feasibility, but excessive optimism risks complacency. Conversely, focusing solely on remaining gaps can foster despair and disengagement. Effective communication needs to navigate this tension, recognizing achievements while maintaining focus on the acceleration still required.
What metrics best capture meaningful climate progress beyond aggregate emissions? While emissions trajectories provide the ultimate bottom line, intermediate indicators—renewable capacity additions, electric vehicle sales, policy adoption, investment flows—offer earlier signals about direction and pace. Developing comprehensive indicator frameworks that capture both outcomes and enabling conditions could provide more nuanced assessment and earlier warning of deviations from needed pathways.
How should assessment frameworks address equity dimensions of climate action? Current tracking often focuses on aggregate emissions reduction, but the distribution of effort, costs, and benefits matters for both justice and political sustainability. Developing metrics that capture just transition progress, climate finance adequacy, and adaptation implementation could provide a more comprehensive picture of whether climate action is proceeding equitably as well as effectively.
What role should independent assessment bodies play in climate governance? Scientific assessments (like the IPCC) provide essential foundations, but ongoing implementation tracking requires different institutional models. Some propose independent climate accountability offices analogous to budget offices, while others emphasize strengthening existing transparency frameworks. The institutional design for credible, regular progress assessment remains an evolving aspect of climate governance.
How can assessment processes better connect global trajectories with local actions? Global aggregates can feel abstract and distant from specific policy decisions or individual actions. Developing frameworks that connect local, national, and global levels—showing how specific measures contribute to broader goals—could enhance both accountability and agency. This multi-level integration represents both a technical challenge (in measurement) and a communication challenge (in presentation).
These questions have no simple answers, but engaging with them can improve how we track, understand, and accelerate climate action. As we navigate the remainder of the critical decade, the quality of our assessment—both what we measure and how we interpret it—will significantly influence our ability to make necessary course corrections toward climate-safe futures.