
Measuring Social Impact: The Metrics and Frameworks That Prove Your Purpose
Learn how to effectively measure and communicate your social impact. This guide covers essential frameworks, metrics, and tools to prove your organization’s value to funders, investors, and stakeholders.

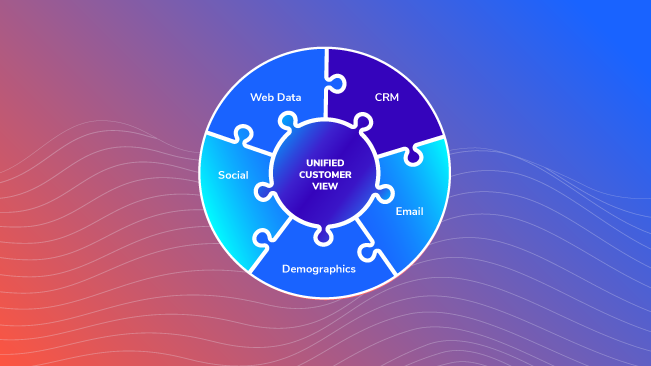
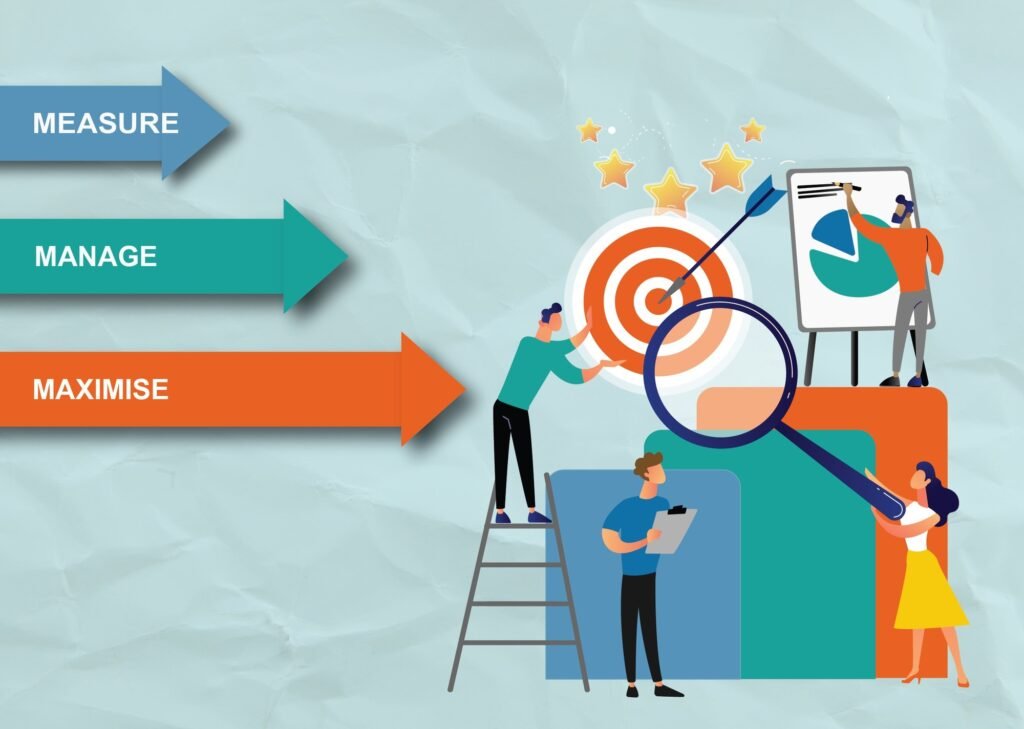
The Social Impact Measurement Cycle: A continuous process of planning, tracking, and evaluating to maximize positive change.
Introduction: Why Counting What Counts Matters
In the world of social entrepreneurship and impact investing, good intentions are no longer enough. The ability to demonstrate tangible, measurable results has become the currency of credibility. Measuring social impact is the systematic process of quantifying the social, environmental, and economic changes that result from an organization’s activities. It’s the practice of moving from anecdotal “feel-good” stories to data-driven evidence of change.
For social enterprises, nonprofits, and impact-driven corporations, robust impact measurement is not just an administrative burden—it’s a strategic imperative. It enables better decision-making, attracts funding, improves programs, and ultimately, maximizes the good you can do in the world. In an era demanding transparency and accountability, proving your purpose is as crucial as defining it. This discipline is fundamental to all the topics we cover in our Sustainable Future focus area.
Background/Context: The Evolution of Impact Accountability
The field of impact measurement has evolved significantly over the past few decades. Initially, nonprofit evaluation focused on simple output metrics—counting activities rather than assessing outcomes (e.g., “meals served” rather than “nutritional health improved”). The 1990s saw the rise of outcomes-based evaluation, pushed by funders demanding proof of effectiveness.
The 21st century brought a revolution with the emergence of standardized frameworks. The founding of the Global Impact Investing Network (GIIN) and its creation of the IRIS+ system provided a common language for impact investors. Simultaneously, approaches like Social Return on Investment (SROI) emerged, attempting to assign a monetary value to social outcomes. This evolution reflects a broader shift across sectors towards data-driven management, similar to the optimization seen in Global Supply Chain Management.
Key Concepts Defined: The Lexicon of Impact Proof
- Impact Measurement: The process of quantifying the social and environmental effects of an organization’s activities.
- Theory of Change: A comprehensive description and illustration of how and why a desired change is expected to happen in a particular context. It is the foundational roadmap for measurement.
- Logic Model: A visual representation that links resources (inputs), activities, outputs, outcomes, and impact.
- Social Return on Investment (SROI): A framework for measuring and accounting for the broader concept of value, beyond financial profit. It seeks to reduce inequality and environmental degradation and improve wellbeing by incorporating social, environmental, and economic costs and benefits.
- IRIS+: The generally accepted system for measuring, managing, and optimizing impact, managed by the GIIN. It provides standardized metrics and guidance for impact investors and enterprises.
- Outputs vs. Outcomes vs. Impact:
- Outputs: The direct, tangible products of activities (e.g., 100 students trained).
- Outcomes: The changes or benefits that result from the outputs (e.g., 80% of trained students secured a job).
- Impact: The long-term, sustainable change resulting from the outcomes (e.g., reduced youth unemployment in the community).
How It Works (Step-by-Step): The Impact Measurement Cycle
Implementing a robust impact measurement system follows a continuous, cyclical process.
Step 1: Define Your Theory of Change
This is the crucial first step. Map out your pathway to impact by answering:
- What is the long-term impact we seek?
- What intermediate outcomes must occur to achieve that impact?
- What activities will we undertake to drive those outcomes?
- What inputs/resources are required?
Your Theory of Change becomes your strategic blueprint and the basis for all subsequent measurement.
Step 2: Select Your Framework and Metrics
Choose a framework that fits your needs and audience.
- For attracting impact investors, use IRIS+ to select standardized metrics.
- For communicating value to a broad audience, consider SROI.
- For internal management, a simple Logic Model might suffice.
Select a limited set of Key Performance Indicators (KPIs) for each outcome in your Theory of Change. Avoid “metric fatigue” by focusing on what truly matters.
Step 3: Establish a Baseline and Set Targets
Before you begin, measure the current state of your key metrics. What is the unemployment rate before your training program? What is the carbon footprint before your intervention? This baseline is essential for proving that your activities caused the change. Then, set realistic, time-bound targets for improvement.
Step 4: Collect Data Systematically
Implement systems to gather data consistently. Methods can include:
- Surveys and Questionnaires
- Interviews and Focus Groups
- Direct Observation
- Analysis of Administrative Data (e.g., attendance records, sales figures)
Use technology like CRM systems or specialized impact software to streamline collection. This operational discipline is as important as the financial planning in any E-commerce Business.
Step 5: Analyze and Report the Data
Turn raw data into actionable insights. Calculate your KPIs, analyze trends, and compare results against your baseline and targets. Create clear, compelling impact reports for different stakeholders—detailed reports for funders, summary dashboards for management, and inspiring stories for the public.
Step 6: Learn, Adapt, and Improve
This is the most critical step. Use the findings to make informed decisions. Which activities are most effective? Where are we falling short? This cycle of learning and adaptation ensures your organization is not just proving its impact, but actively maximizing it.
Why It’s Important: The Power of Proof
- Attracts and Retains Funding: Impact investors, grantmakers, and donors increasingly require robust impact data. Proof of effectiveness is the key to unlocking capital.
- Improves Program Effectiveness: Data reveals what works and what doesn’t, allowing you to allocate resources to the most effective activities and improve or stop underperforming ones.
- Builds Credibility and Trust: Transparent impact reporting builds trust with all stakeholders, from the communities you serve to the public at large.
- Informs Strategic Decisions: It moves decision-making from gut instinct to evidence-based strategy, ensuring the organization stays focused on its mission.
- Boosts Team Morale: Demonstrating tangible results provides a powerful sense of accomplishment and purpose for staff and volunteers, contributing positively to their Mental Wellbeing.
Common Misconceptions
- “It’s too expensive and complex for a small organization.” Start small. You don’t need a six-figure evaluation budget. Begin with a simple Theory of Change and track 3-5 key metrics that are easy to collect. Complexity can grow with your organization.
- “Our stories are proof enough.” Stories are powerful for communication but are anecdotal and subject to bias. Data provides the objective evidence that validates your stories and shows the scale of your impact.
- “If we can’t measure it, it doesn’t matter.” Some of the most important outcomes (like dignity, self-esteem, or community cohesion) are difficult to quantify. The goal is to find meaningful proxies and use mixed methods (quantitative and qualitative) to build a complete picture.
- “Measurement is just for reporting to funders.” This is a costly mistake. When treated as a compliance exercise, measurement is a burden. When used as a management tool, it is a source of strategic advantage and learning.
Recent Developments & Success Stories
Recent Development: The Aligned IRIS+ and SDG Framework
A major step forward has been the alignment of the IRIS+ system with the United Nations Sustainable Development Goals (SDGs). This allows organizations to use standardized metrics to report directly on their contribution to the global goals (e.g., SDG 1: No Poverty, SDG 13: Climate Action). This creates a universal language for impact, making it easier for investors and enterprises to connect and compare performance.
Success Story: Acumen’s Lean Data Approach
The pioneer impact investor Acumen developed “Lean Data,” a methodology to make impact measurement more affordable, timely, and customer-centric for the social enterprises in its portfolio. It uses technologies like SMS surveys and interactive voice response to gather data directly from end-users quickly and cheaply. This approach has demonstrated that high-quality impact data is accessible to organizations of all sizes, shifting the paradigm from expensive, external evaluations to integrated, user-focused data collection.
Case Study & Lessons Learned: The SROI of a Youth Employment Program
Case Study: A nonprofit running a job-training program for at-risk youth decided to conduct an SROI analysis. They tracked outcomes like increased earnings for graduates, reduced welfare dependency, and lower incarceration rates. They assigned financial proxies to these outcomes (e.g., average wage, cost of incarceration to the state) and compared them to the program’s costs.
Lessons Learned:
- The Power of a Financial Ratio: The analysis revealed an SROI of £4.50 for every £1 invested. This powerful, succinct figure was incredibly effective in communicating value to government funders and corporate sponsors.
- Importance of Stakeholder Involvement: The most credible financial proxies came from engaging with stakeholders. They learned from employers the value of a trained employee and from the justice system the cost of a prisoner.
- It’s an Estimate, Not a Perfect Number: SROI requires making assumptions. The key is to be transparent about these assumptions, use conservative estimates, and present a range of values. The goal is to be “roughly right rather than precisely wrong.”
Real Life Examples
- Kickstarter’s Public Benefit Reporting: As a Public Benefit Corporation, Kickstarter publishes an annual “Public Benefit Statement” that details its social and environmental performance against specific goals, using a mix of quantitative metrics and qualitative explanations.
- Danone’s “One Person, One Voice, One Share”: The company measures its social impact through employee engagement, tracking the percentage of employees who are shareholders and participate in its annual survey and vote, linking internal democracy to corporate impact.
- BRAC’s Ultra-Poor Graduation Program: One of the world’s most effective anti-poverty programs, BRAC uses rigorous randomized controlled trials (RCTs) to measure its impact on income, asset accumulation, and food security, providing gold-standard evidence of its success.
Conclusion & Key Takeaways
Measuring social impact transforms good intentions into accountable, effective action. It closes the loop between ambition and achievement, ensuring that resources are directed toward creating the greatest possible positive change.
Key Takeaways:
- Start with Your Theory of Change: This is the non-negotiable foundation. Without a clear roadmap, you cannot know what to measure.
- Focus on Outcomes, Not Just Outputs: Move beyond counting activities to demonstrating the real changes you create in people’s lives and the environment.
- Embrace Standardized Frameworks: Using systems like IRIS+ makes your data comparable and credible to a wider audience, especially investors.
- Integrate Measurement into Operations: Impact data should be collected as part of daily work, not as a separate, burdensome project.
- Use Data for Learning, Not Just Reporting: The ultimate goal is to create a learning organization that continuously improves its effectiveness.
In the pursuit of a better world, hope is the fuel, but data is the compass. By mastering the art and science of impact measurement, you ensure that your organization is not just doing good, but doing good well. For more insights on building effective organizations, explore our piece on What is a DAO? and other articles in our Blog.
Frequently Asked Questions (FAQs)
1. What is the simplest way to start measuring impact?
Begin by defining your Theory of Change on a single page. Then, choose one key outcome and one simple way to measure it (e.g., a pre- and post-program survey).
2. How is measuring social impact different from ESG reporting?
ESG (Environmental, Social, Governance) reporting focuses on how a company’s own operations manage risks and opportunities related to sustainability. Social impact measurement focuses on the external effects of a company’s products, services, or operations on society and the environment.
3. What is a good SROI ratio?
There’s no universal standard, as it depends on the sector and the problem being addressed. Generally, a ratio above 1:1 indicates the social value created exceeds the cost of the investment. A higher ratio is better, but credibility and transparency in the calculation are paramount.
4. How often should we measure our impact?
It depends on the outcomes. Some metrics (e.g., customer satisfaction) can be tracked continuously. Others (e.g., long-term changes in income) may be measured annually. The key is consistency.
5. Can we measure impact without a control group?
Yes, but it’s less rigorous. A control group provides the strongest evidence that your activities caused the change. Without one, you must be more cautious in claiming causality and rely more on stakeholder testimony and logical links in your Theory of Change.
6. What are the biggest challenges in impact measurement?
Common challenges include: lack of resources, difficulty in isolating your organization’s impact from other factors, quantifying “soft” outcomes, and avoiding the collection of data that is never used.
7. How do we avoid “impact washing”?
Be transparent. Report on both positive and negative findings. Use standardized metrics. Be honest about the limitations of your data and your methodology. Third-party verification can also enhance credibility.
8. What is the role of technology in impact measurement?
Technology is a game-changer. Mobile data collection apps, cloud-based dashboards, and specialized impact management software (like 60Decibels, Sopact) make data collection, analysis, and reporting more efficient and scalable.
9. How do we choose the right metrics?
Go back to your Theory of Change. For each outcome, ask: “What would be the simplest, most convincing evidence that this outcome has been achieved?” Let that guide your choice of metric.
10. Who should be responsible for impact measurement in an organization?
It should be a shared responsibility, but a senior leader (e.g., a Director of Impact) should champion it. Program staff collect data, leadership uses it for strategy, and communications staff report it.
11. How much should a nonprofit budget for impact measurement?
A common rule of thumb is 5-10% of the program budget, but this varies widely. The key is to see it as an investment in effectiveness, not an overhead cost.
12. What is the difference between monitoring and evaluation?
Monitoring is the ongoing, systematic collection of data to track performance against plans. Evaluation is a periodic, in-depth assessment to determine the relevance, effectiveness, and impact of a program.
13. Can for-profit companies use SROI?
Absolutely. Many for-profit social enterprises use SROI to communicate their blended value to investors and customers.
14. How do we communicate complex impact data to a general audience?
Use a mix of formats: a concise executive summary, clear data visualizations (charts, infographics), and powerful, data-backed stories that put a human face on the numbers.
15. Where can I get free resources to help with impact measurement?
The GIIN website offers free access to IRIS+. The SROI Network provides guides. Tools like the “Foundation Center’s Toolbox” offer free templates. For personalized guidance, feel free to Contact Us.